How to Navigate: Click on Production > Downtime and Maintenance > Tabs
Summary Tab
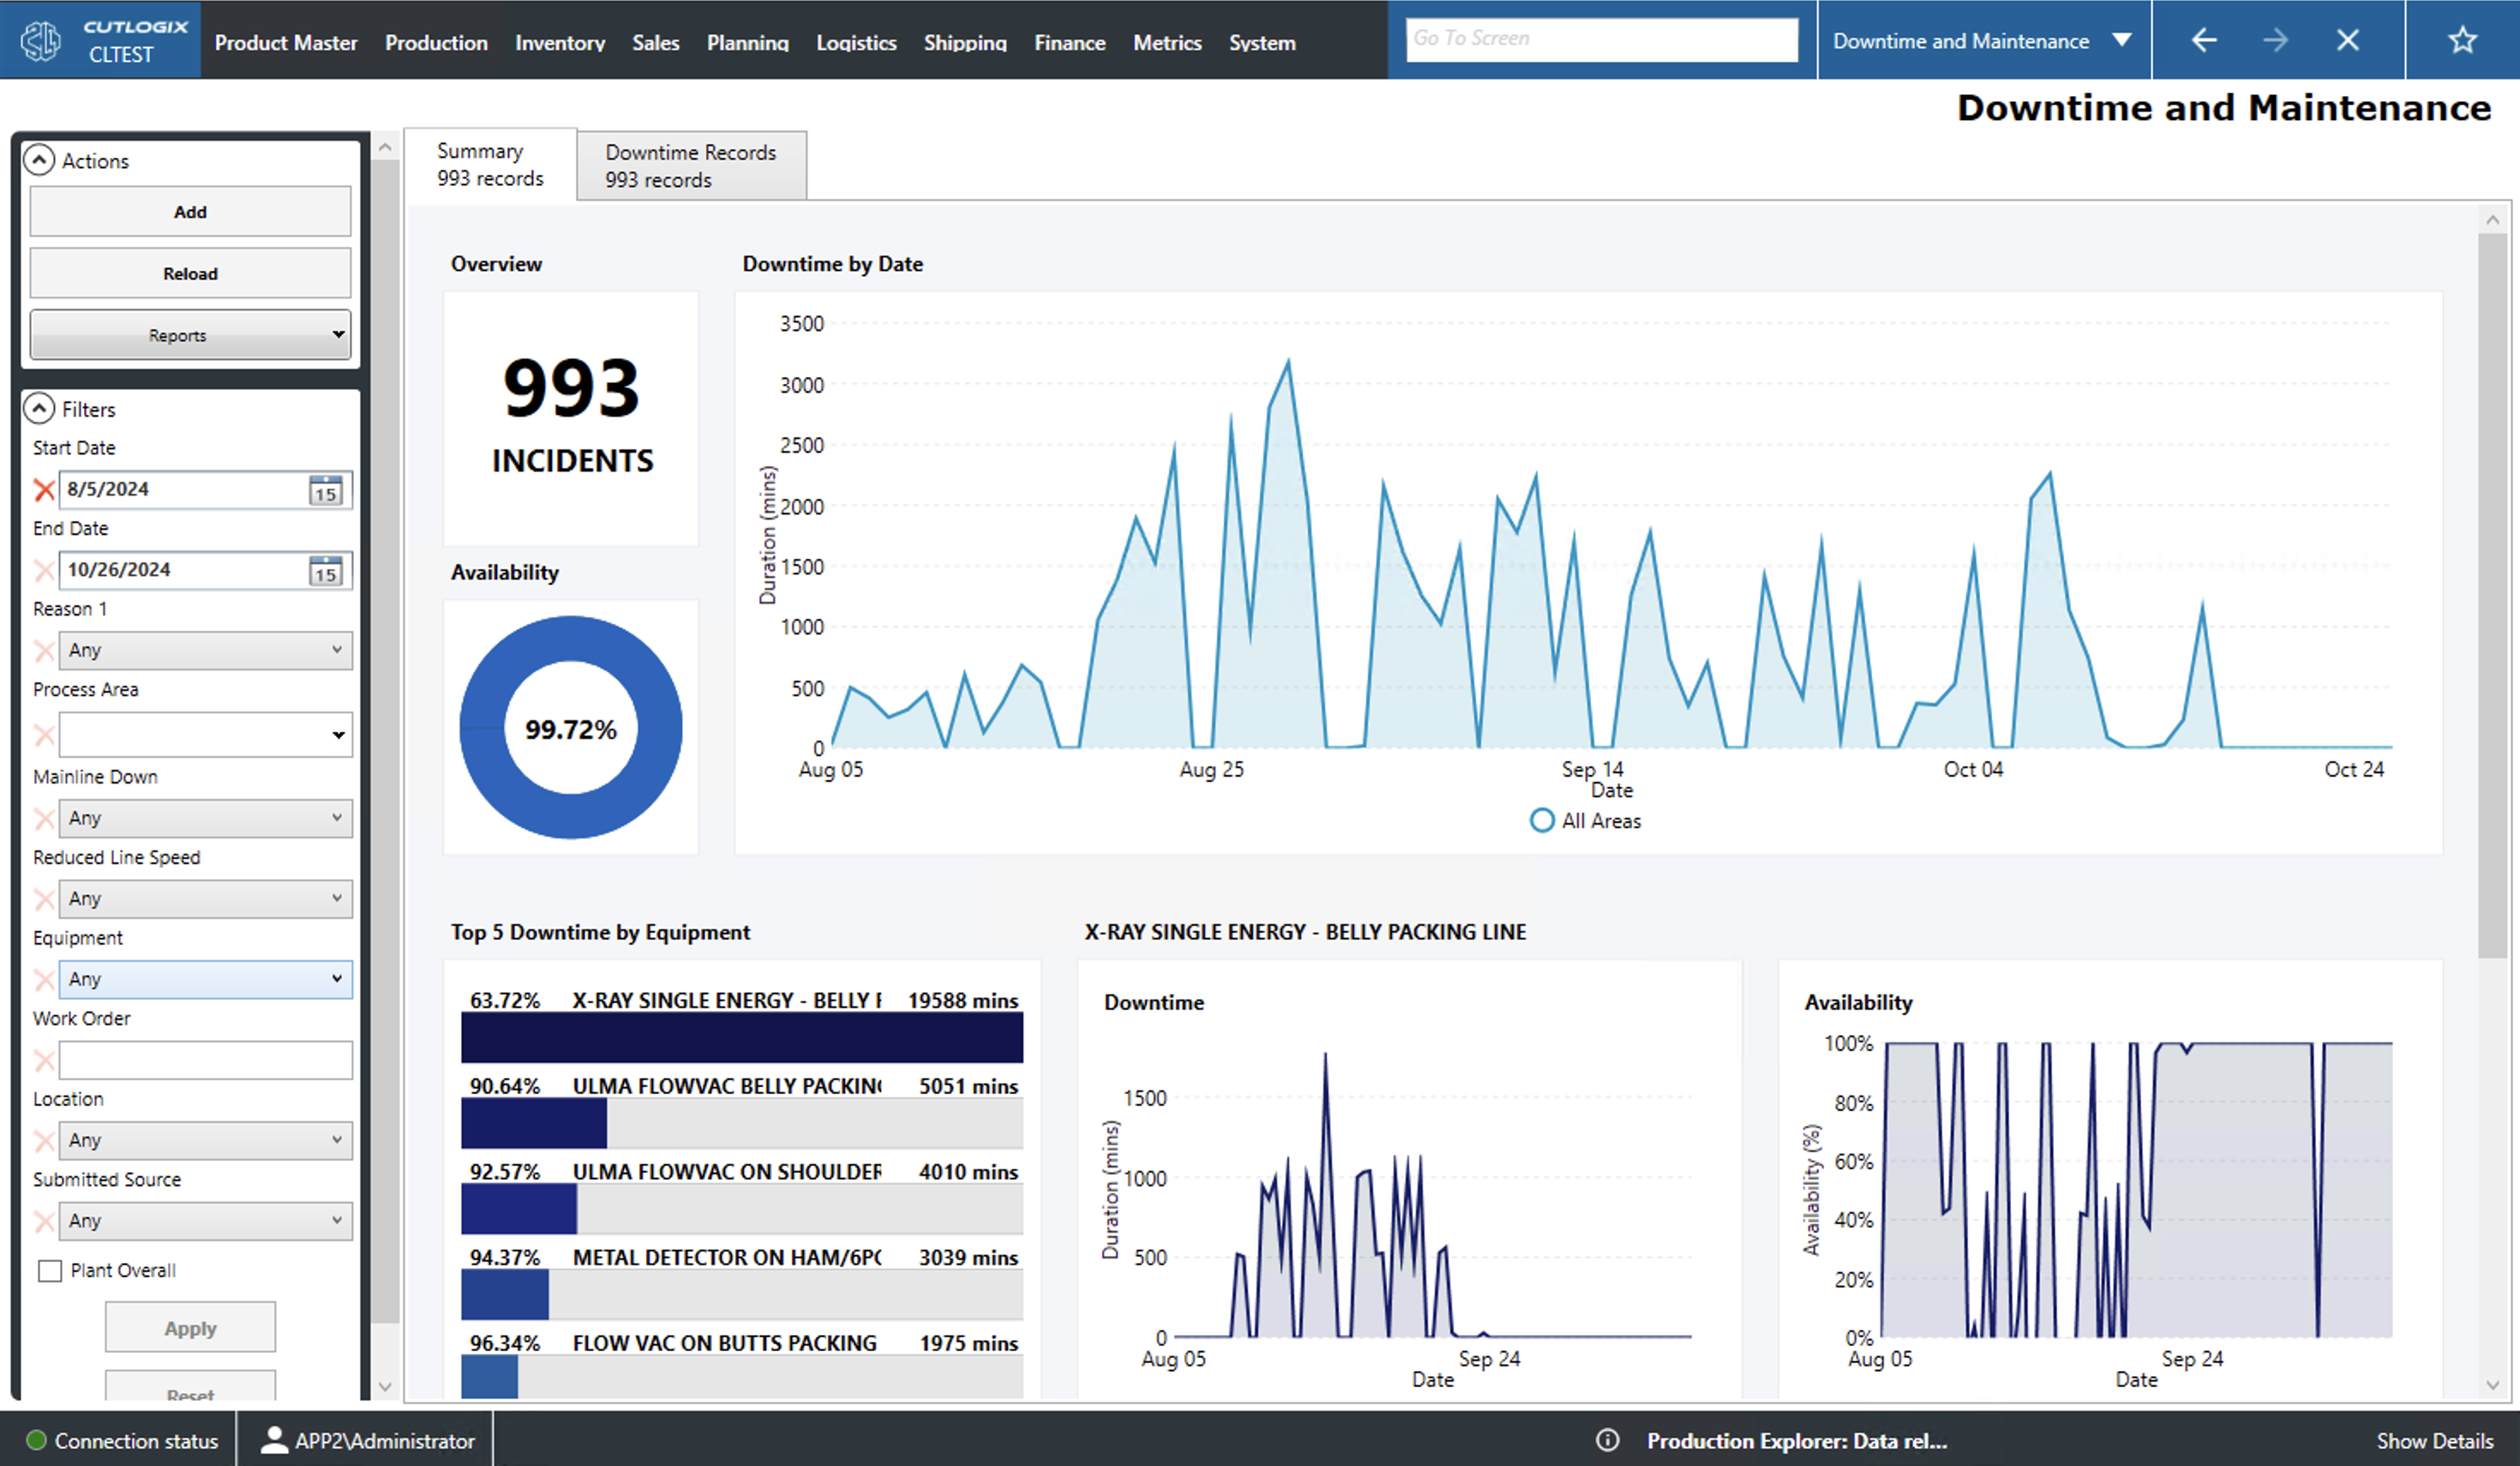
Overview: Gives the number of downtime records that fall within the displayed period. This period can be adjusted using the filter in the left sidepod.
Downtime by Date: This graph shows the amount of downtime in mins for each day of the displayed period.
Availability: This percentage indicates how much of the plants run time in the displayed period was spent producing (i.e. 97% would mean that of the total run time the plant was up for 97% of it and down for 3%).
Other Graphs: The other graphs displayed beneath the first three options can be customized to show a number of specific downtime metrics using the metrics tab.
Downtime Records Tab
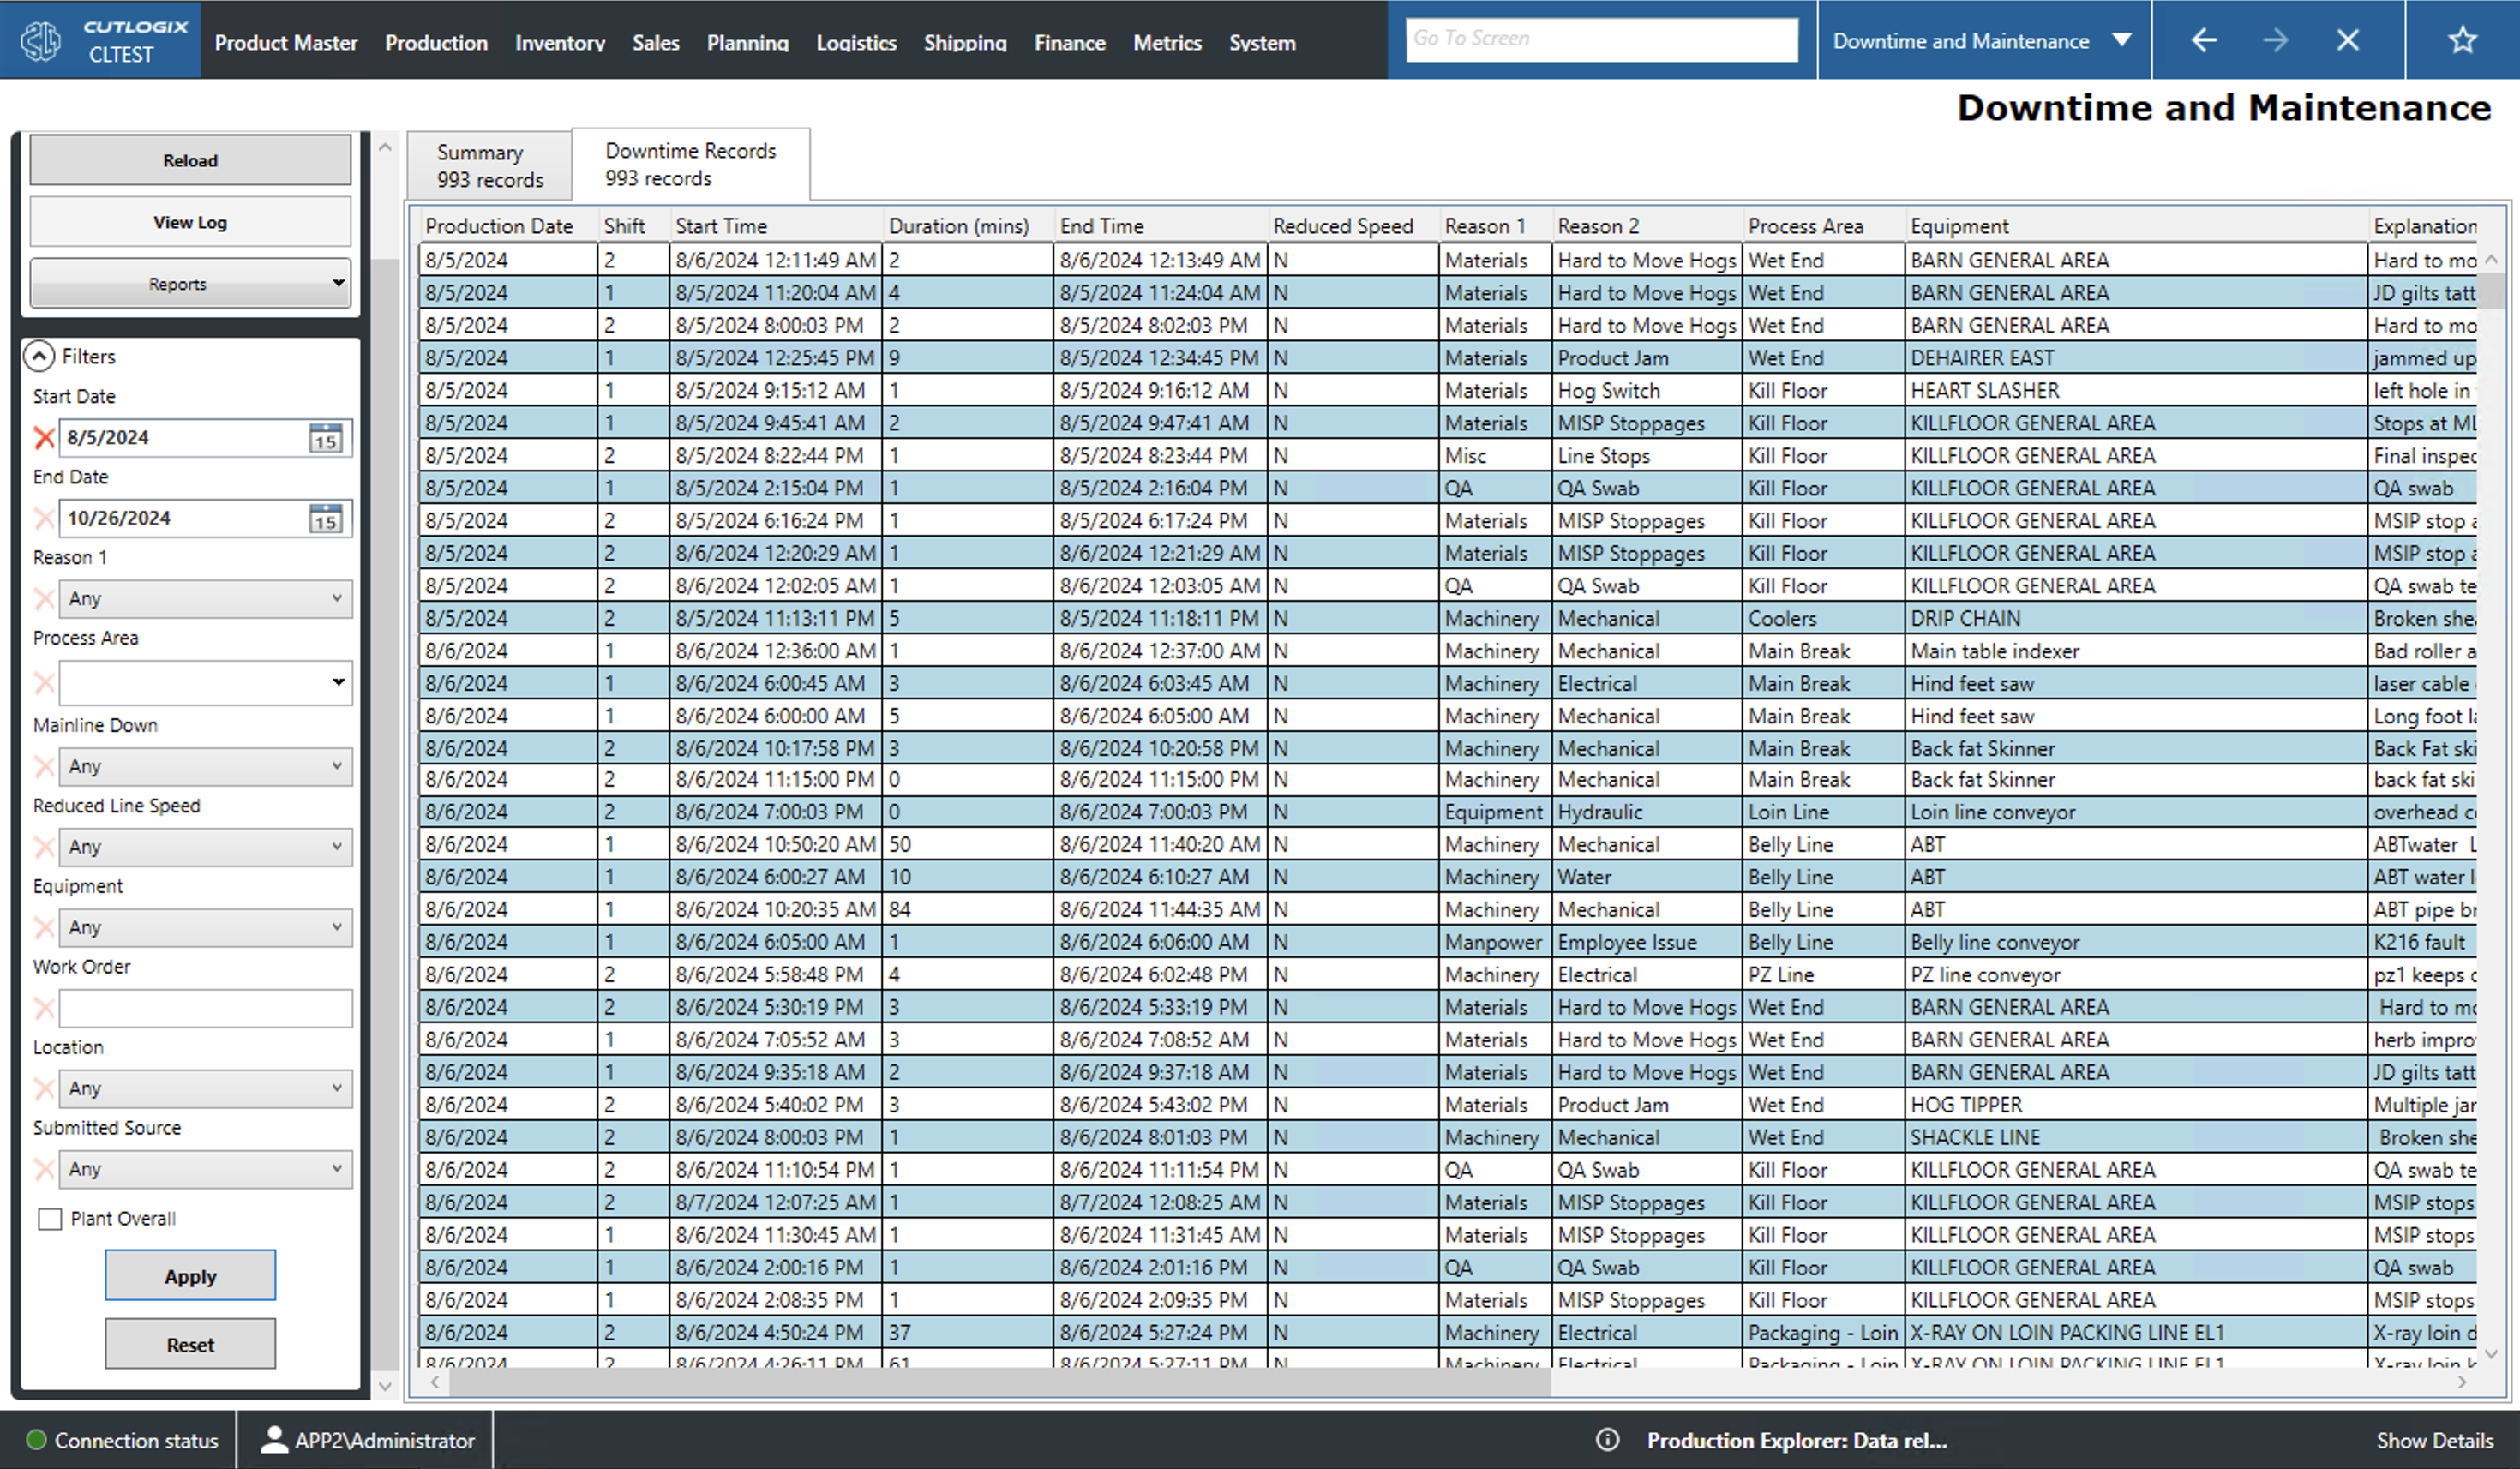
Production Date: The date of the downtime.
Shift: The shift during which the downtime occurred.
Start/End Time: When the downtime began/ended.
Duration (mins): How long the down time lasted.
Reduced Speed: Whether or not the downtime caused reduced line speed.
Reason 1,2: The primary and secondary reasons for the downtime.
Process Area: The area of the plant that experienced the downtime (i.e. specific production line, packaging, cooler, etc.).
Equipment: The equipment that was down during the downtime.
Explanation: An explanation of the downtime.
Location: The plant location that experienced downtime (i.e. the site).
Submitted From: Indicates whether this record was submitted via CutLogix or CutLogix mobile.
Work Order: The work order id for the associated downtime record.
Mainline Down: Indicates whether the mainline was down during the downtime. Y for yes and N for no.
Maintenance Comments: A space for comments about the maintenance work.