Metrics
Metrics Tasks
Creating a Dashboard
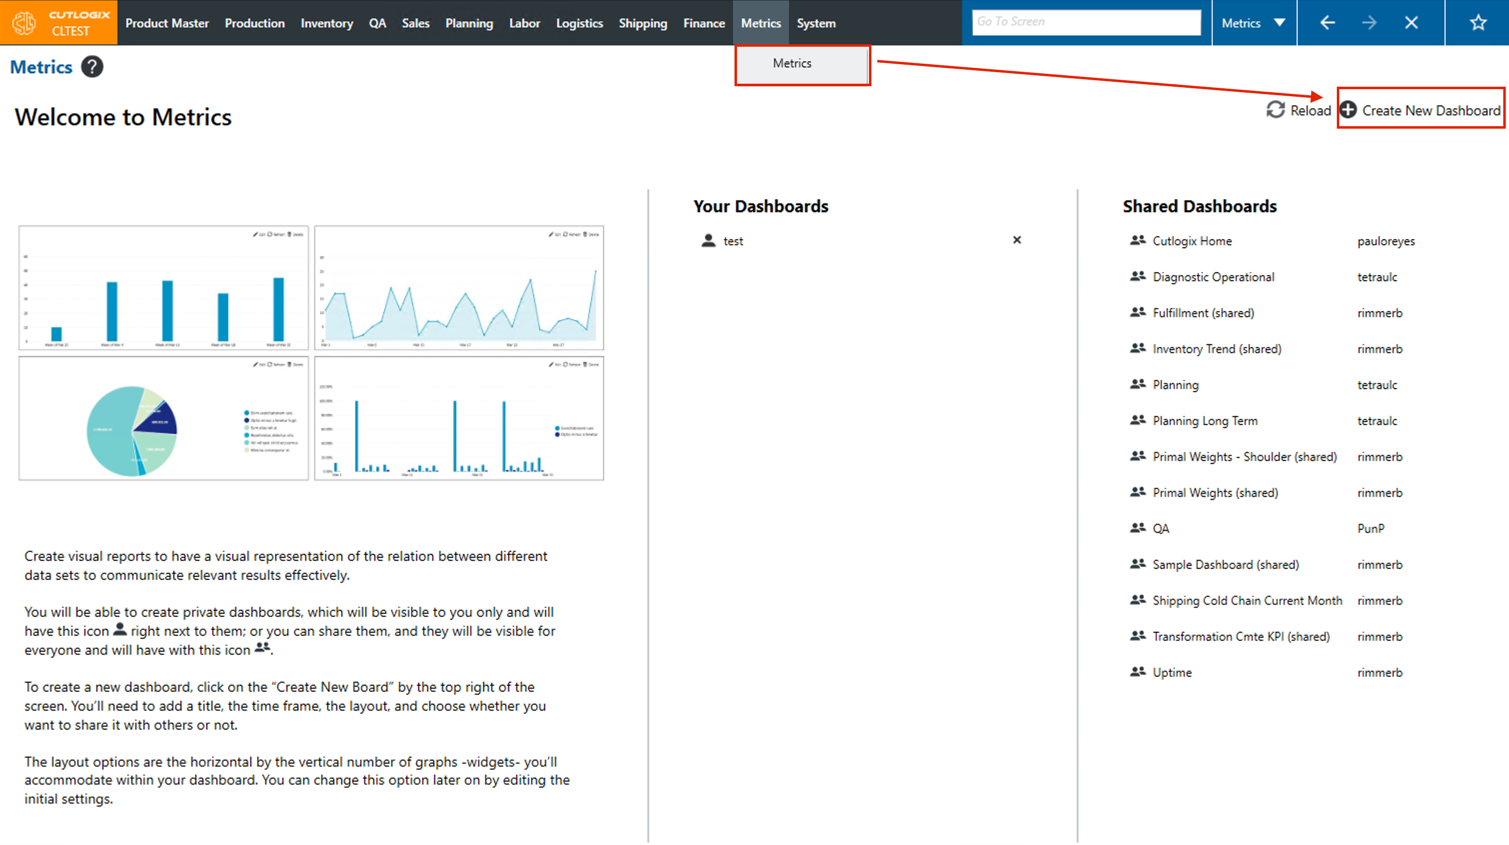
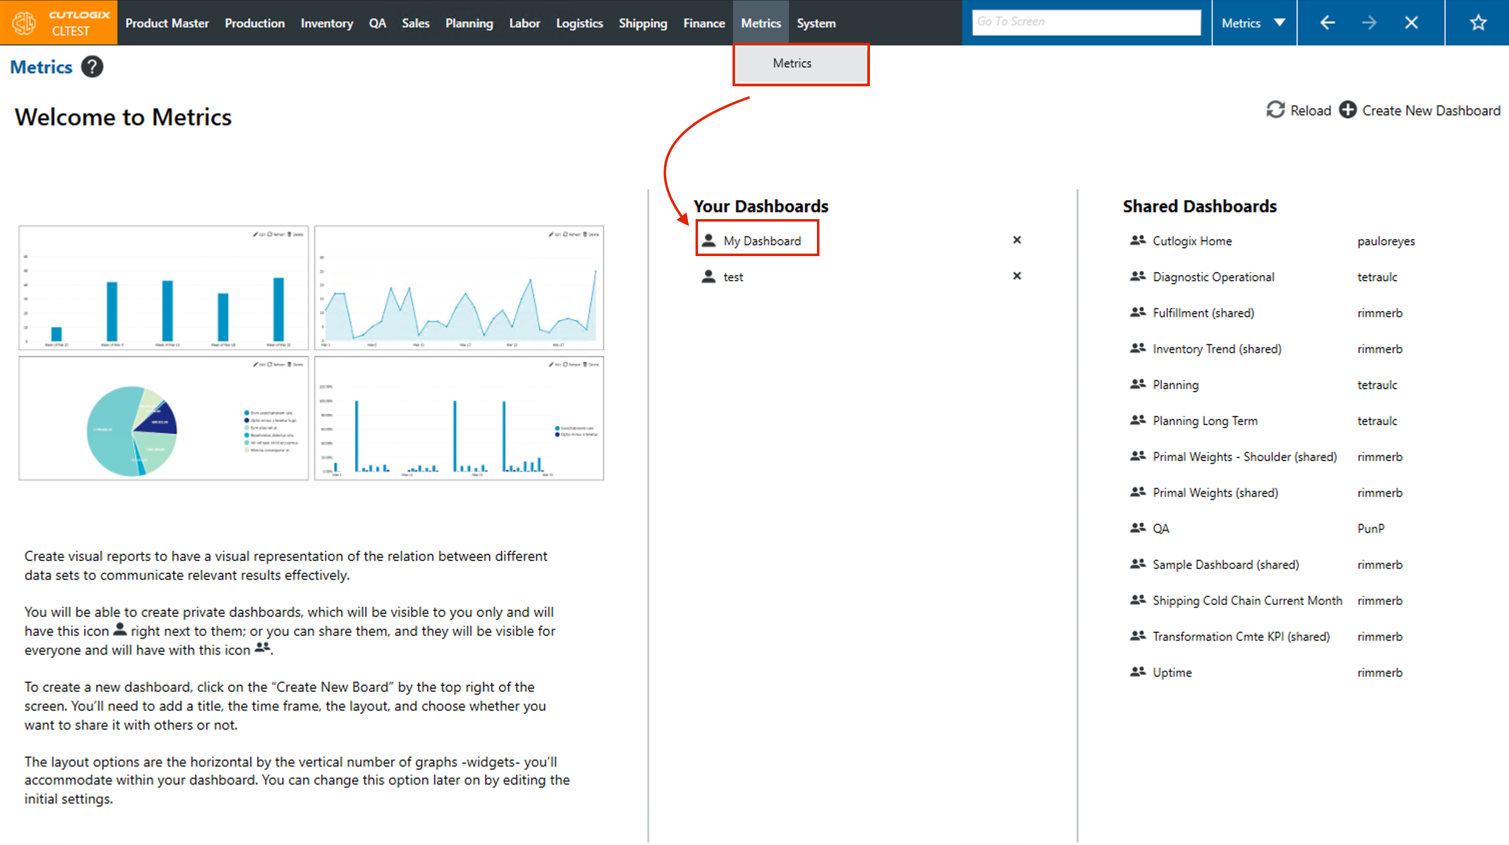
DemoStep 1: Navigate to the "Metrics" page (Under the Metrics menu → Metrics), then click the "Create New Dashboard" button.
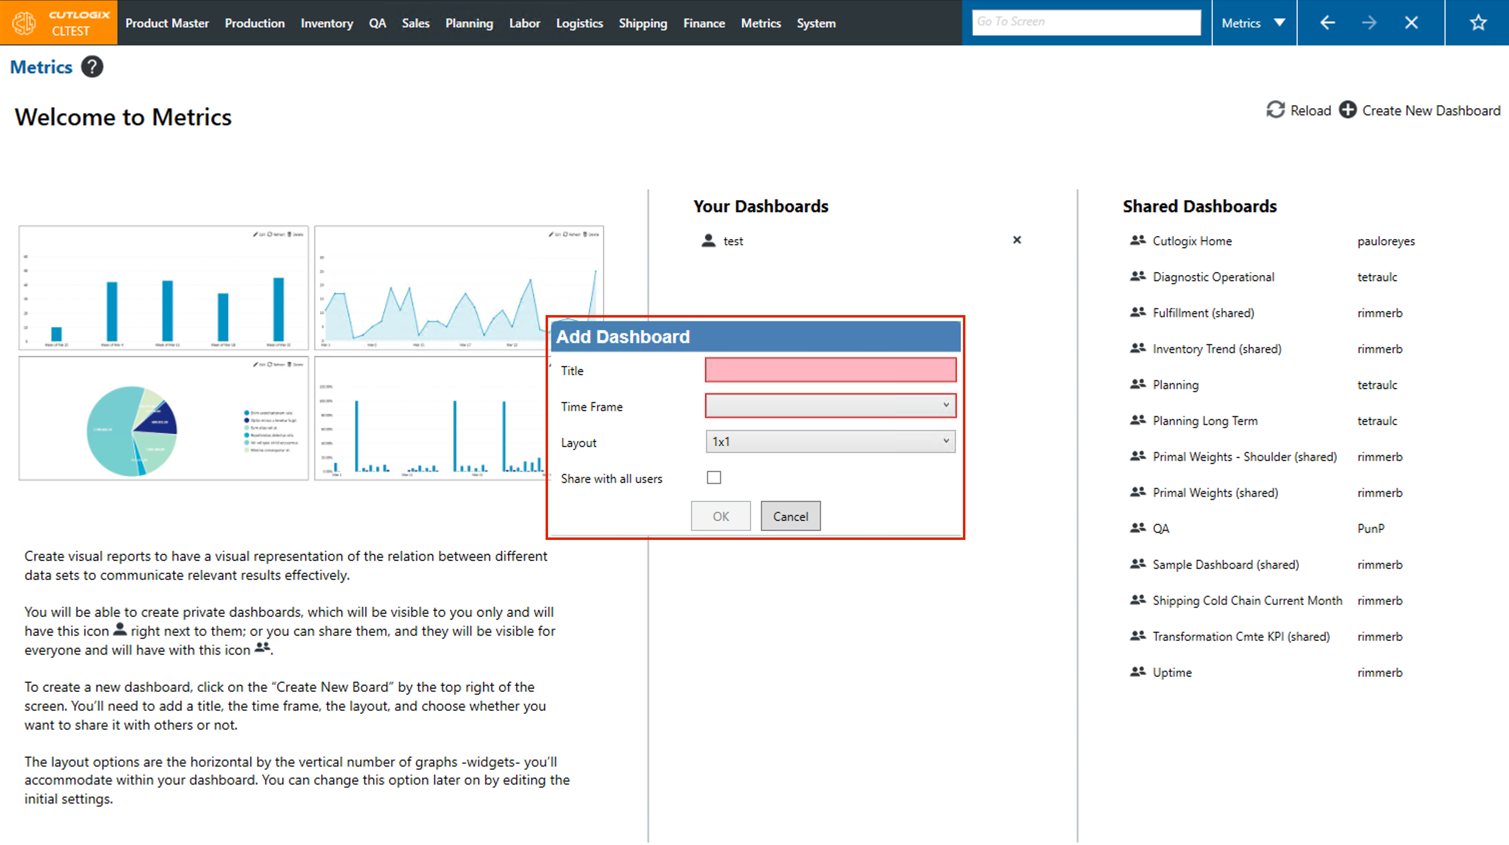
Step 2: A popup will appear, asking you for information about the new dashboard. Fields highlighted in red are required and must be entered before the dashboard can be created. These fields are as follows:
• Title: The name of the new dashboard.
• Time Frame: The span of time from which your dashboard will pull data for the widgets you add.
• Layout: How many widgets you plan to have on your dashboard as well as how they will be displayed.
• Title: The name of the new dashboard.
• Time Frame: The span of time from which your dashboard will pull data for the widgets you add.
• Layout: How many widgets you plan to have on your dashboard as well as how they will be displayed.
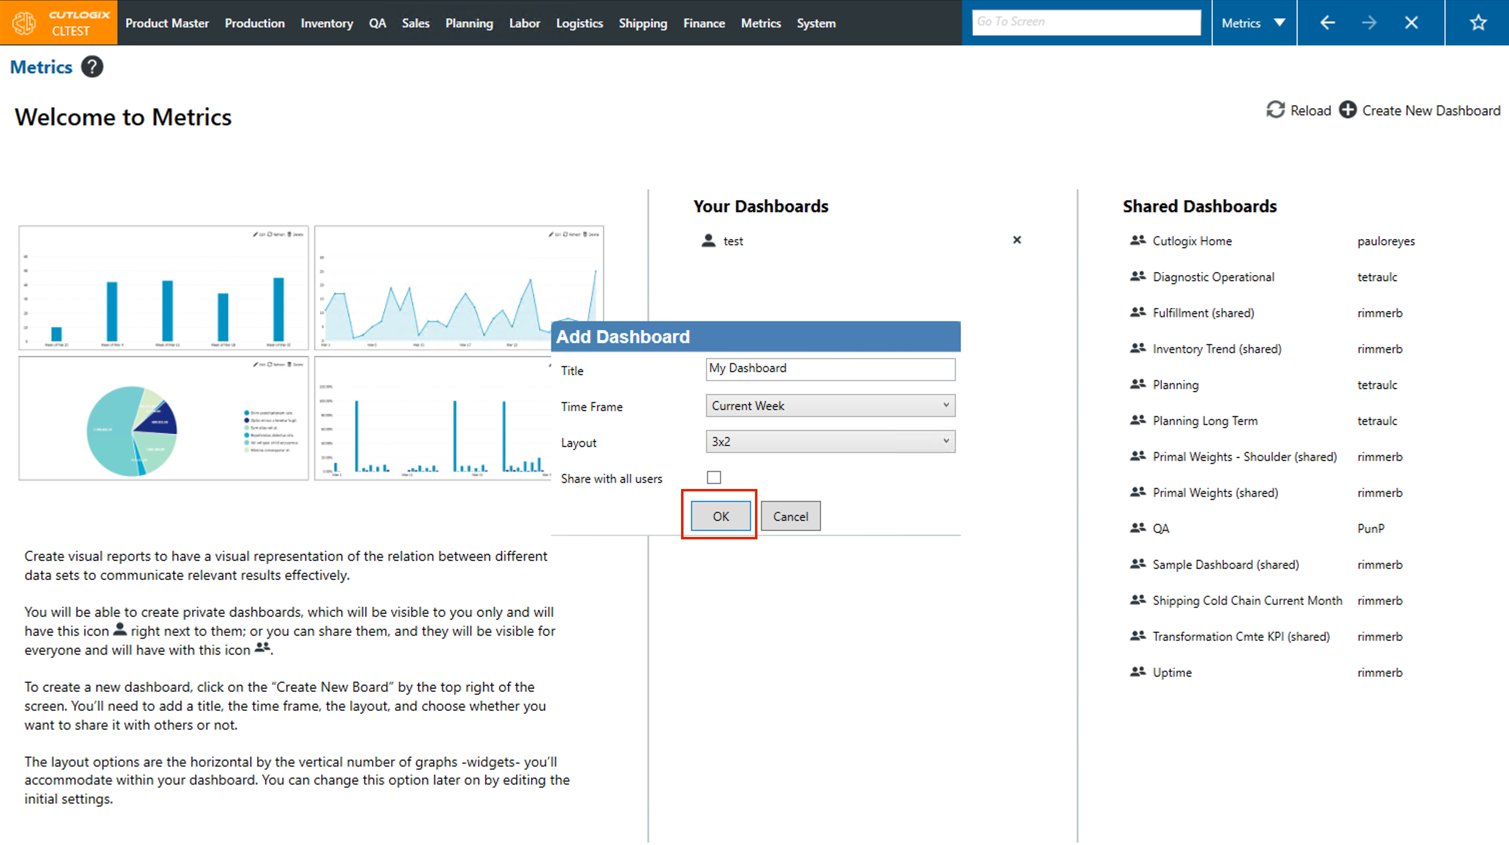
Step 3: Click "OK" to save the new dashboard. You will then be taken to the page for your dashboard where you can then start adding widgets.
Adding Widgets to a Dashboard
DemoStep 1: Navigate to the "Metrics" page (Under the Metrics menu → Metrics), then click the name of the dashboard that you created above, under the "Your Dashboards" title.
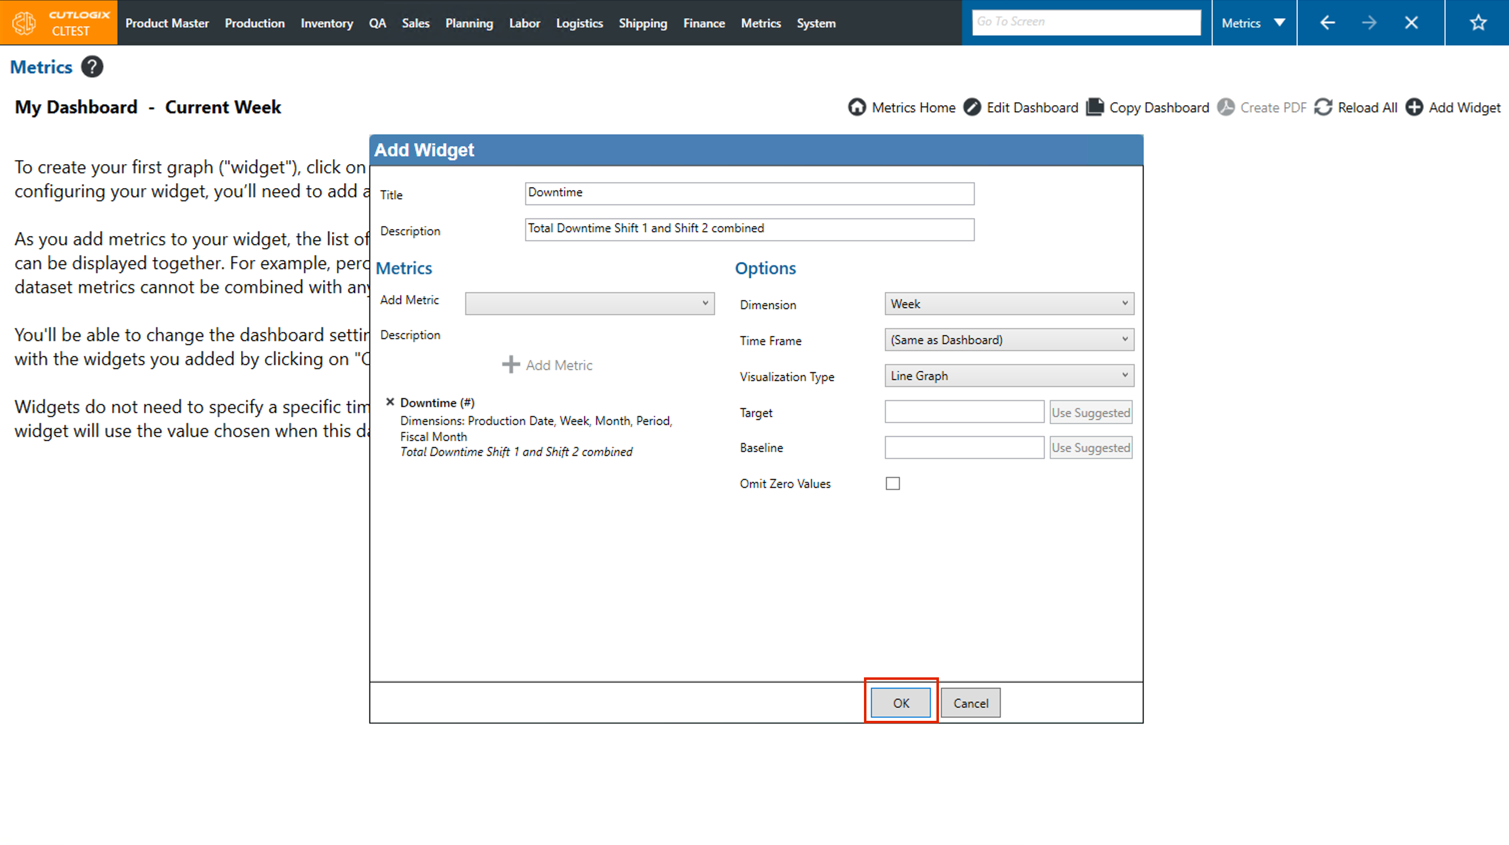
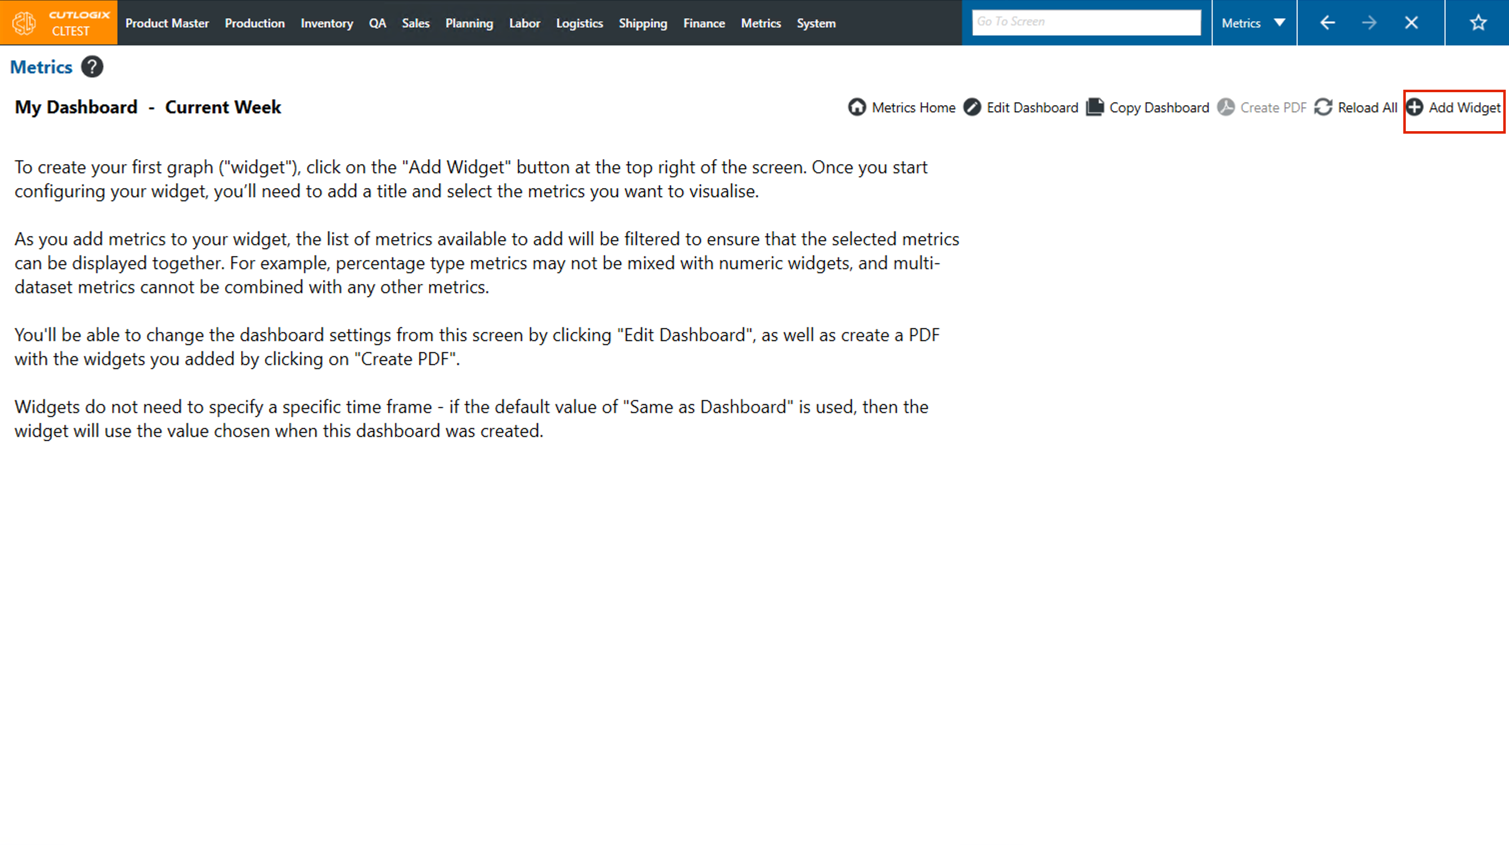
Step 2: Click the "Add Widget" button in the top right corner of the page.
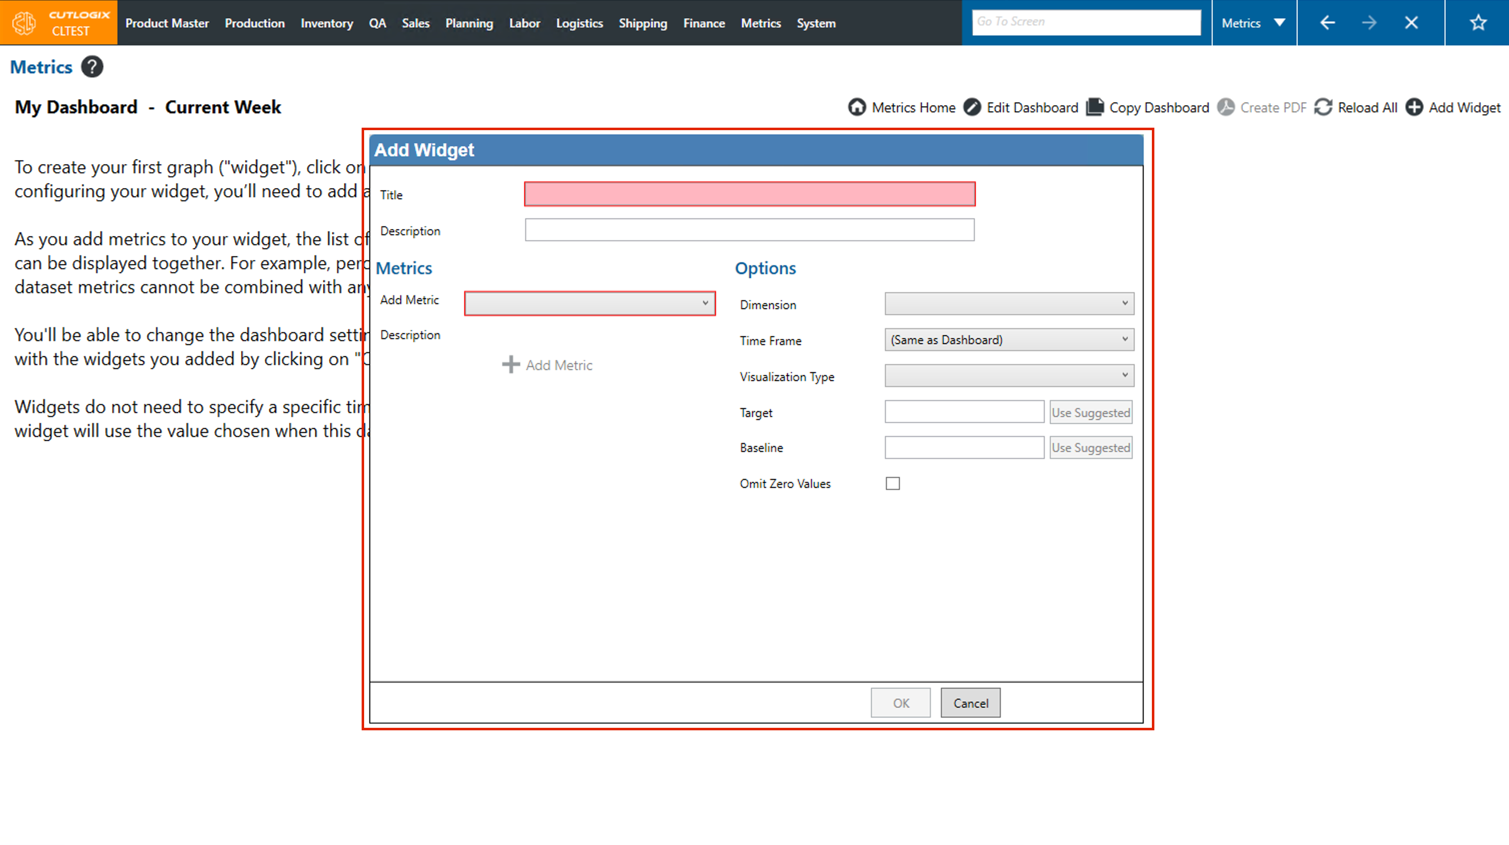
Step 3: The "Add Widget" dialog will appear. On here you can enter information and details about the new widget that you want to add to your dashboard. Fields highlighted in red are required and must be filled out before the widget can be saved, these fields are as follows:
• Title: The title/name of the widget that you are creating.
• Add Metric: Choose the metric that you want to add to the widget from the drop-down list.
Once you've chosen a metric to add, you need to click the "Add Metric" button to specify the details about that metric. After clicking this, some of the "Options" fields on the right side of the screen will be available to edit. Fields highlighted in red are required and must be filled out before the widget can be saved, these fields are as follows:
• Dimension: The time period that the widget should show data for.
• Visualization Type: The type of graph/chart/table that will show the selected data.
Step 4: Click "OK" to savce the new widget. If you don't want to save the new widget, clicking "Cancel" will close the dialog, and the widget will not be saved. Once saved, the widget will appear on your dashboard.