Downtime and Maintenance Overview
How to Navigate: Click on Production > Downtime and Maintenance
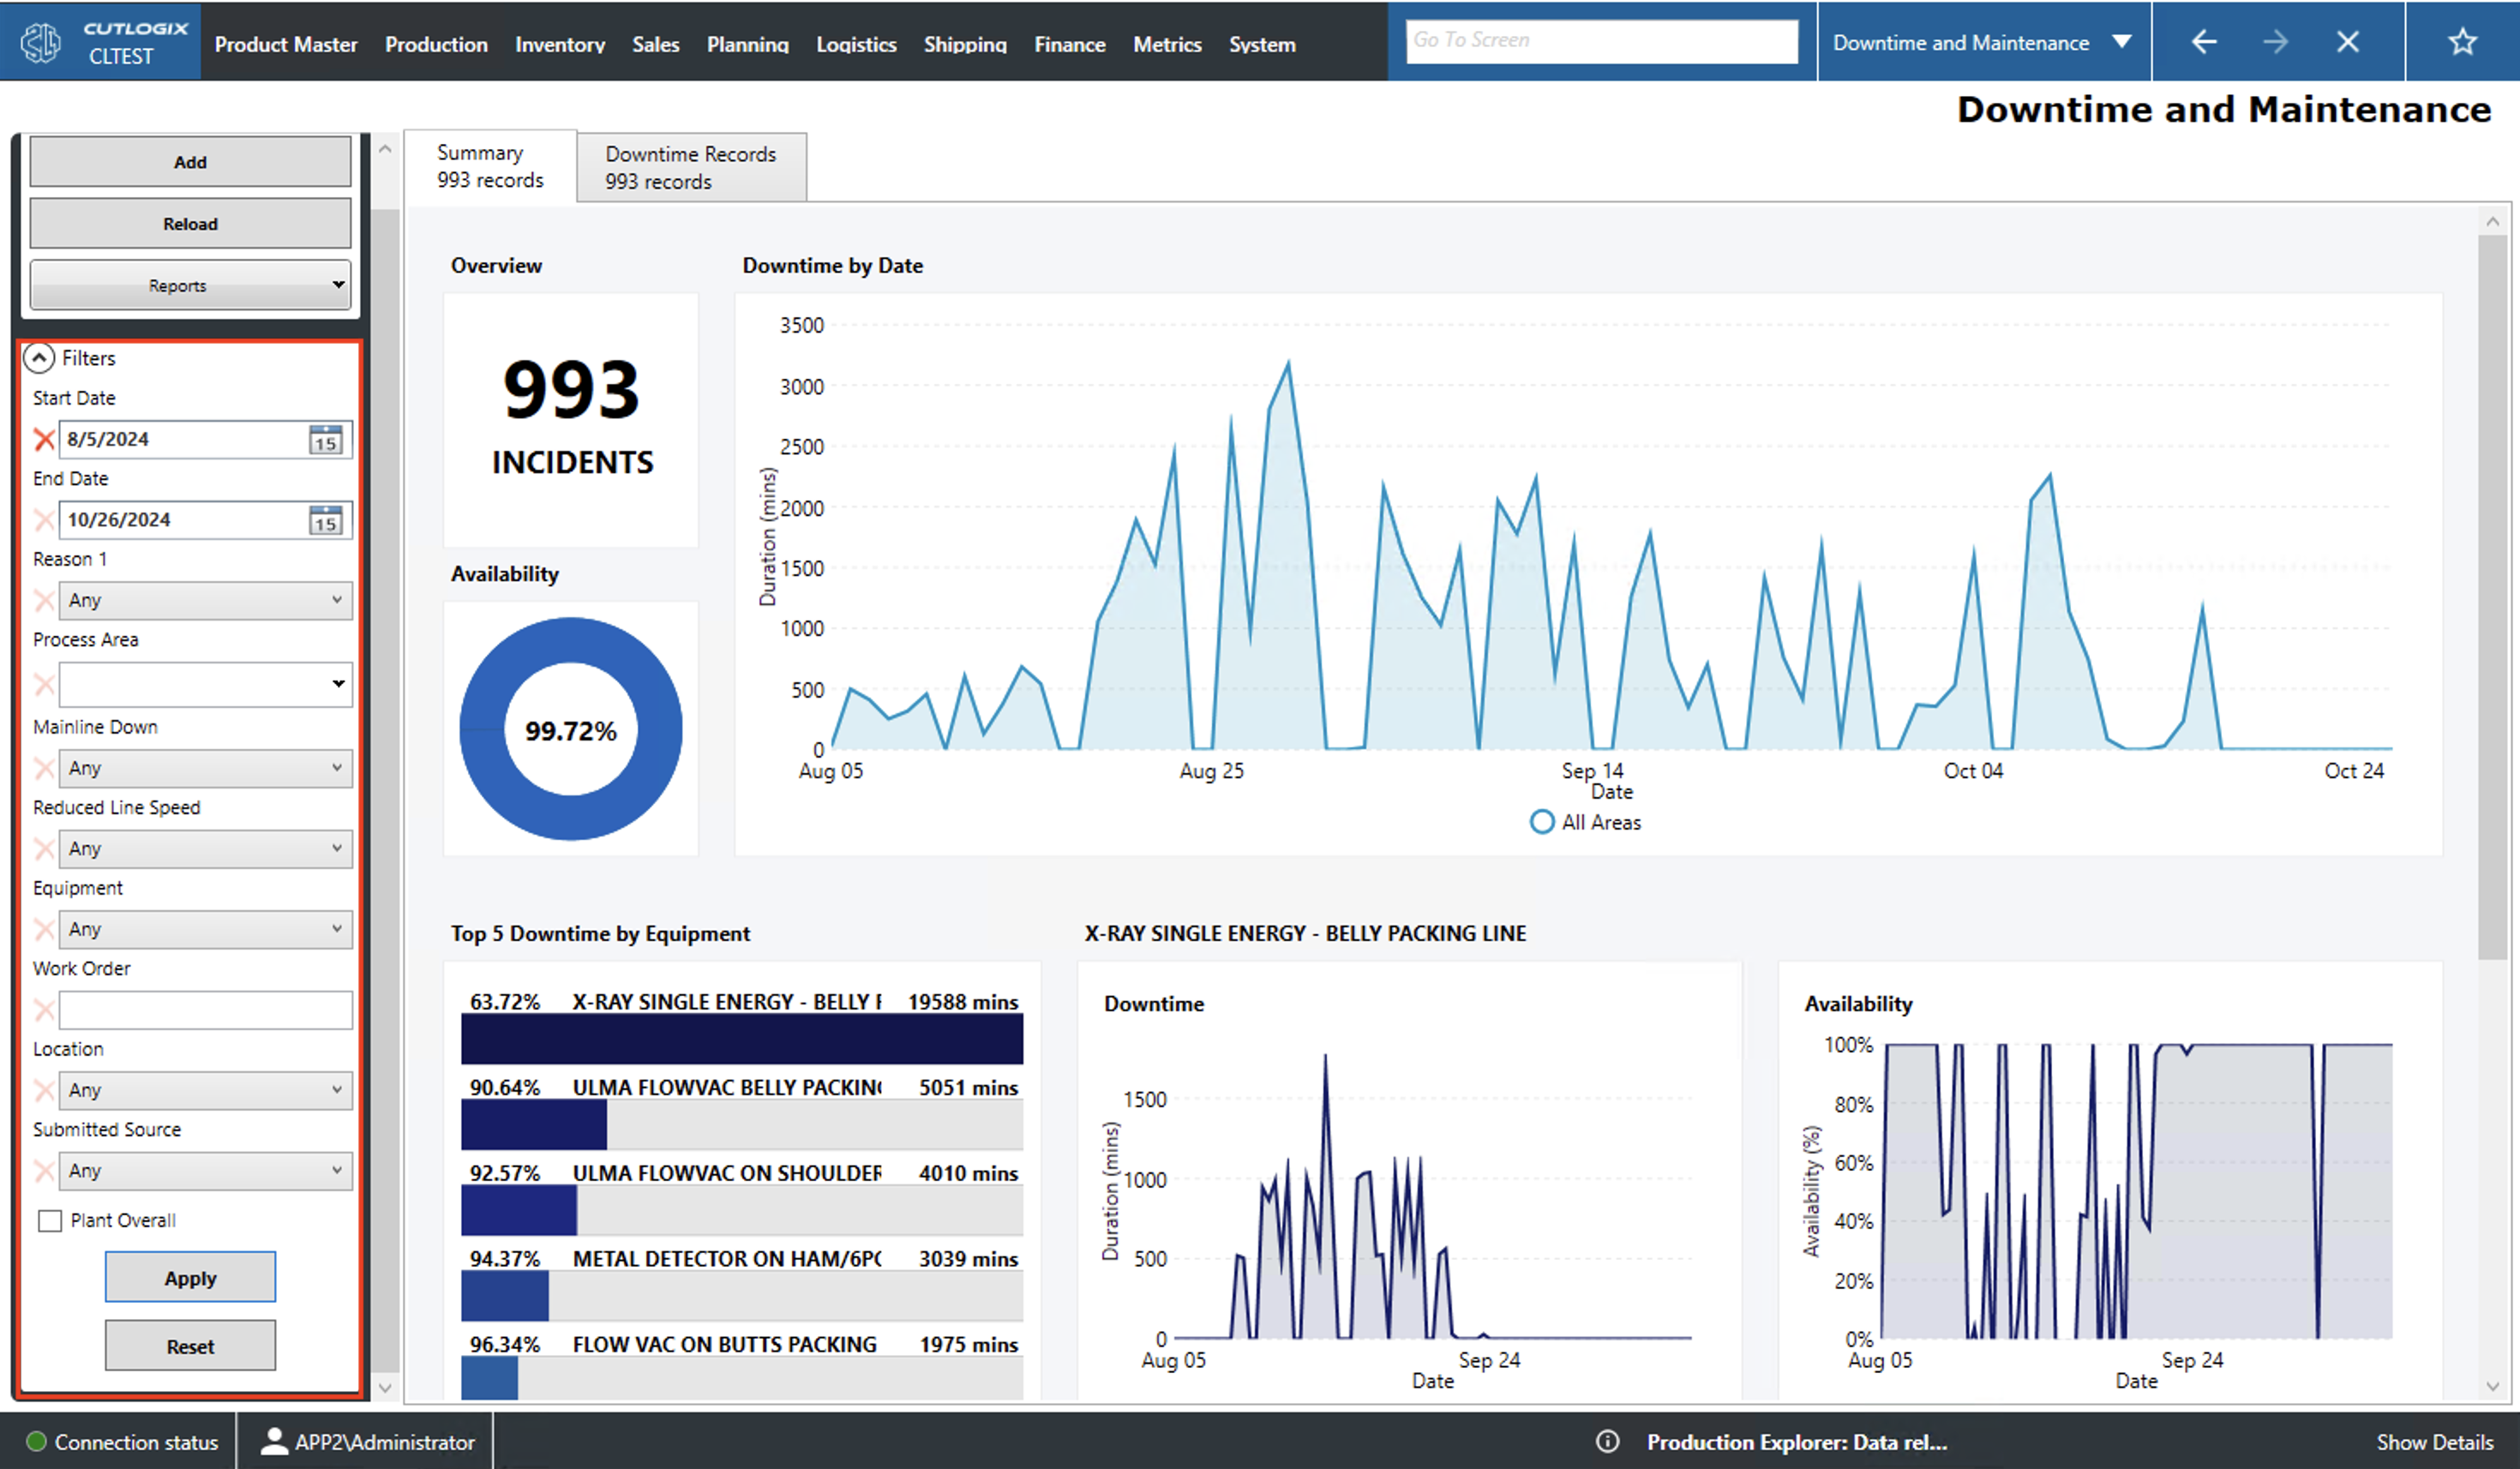
Summary
This page gives information about plant downtime and maintenance. The summary tab provides a visual overview of the plant's downtime. The downtime records tab provides a more granular look at when the plant was down, for how long and why.
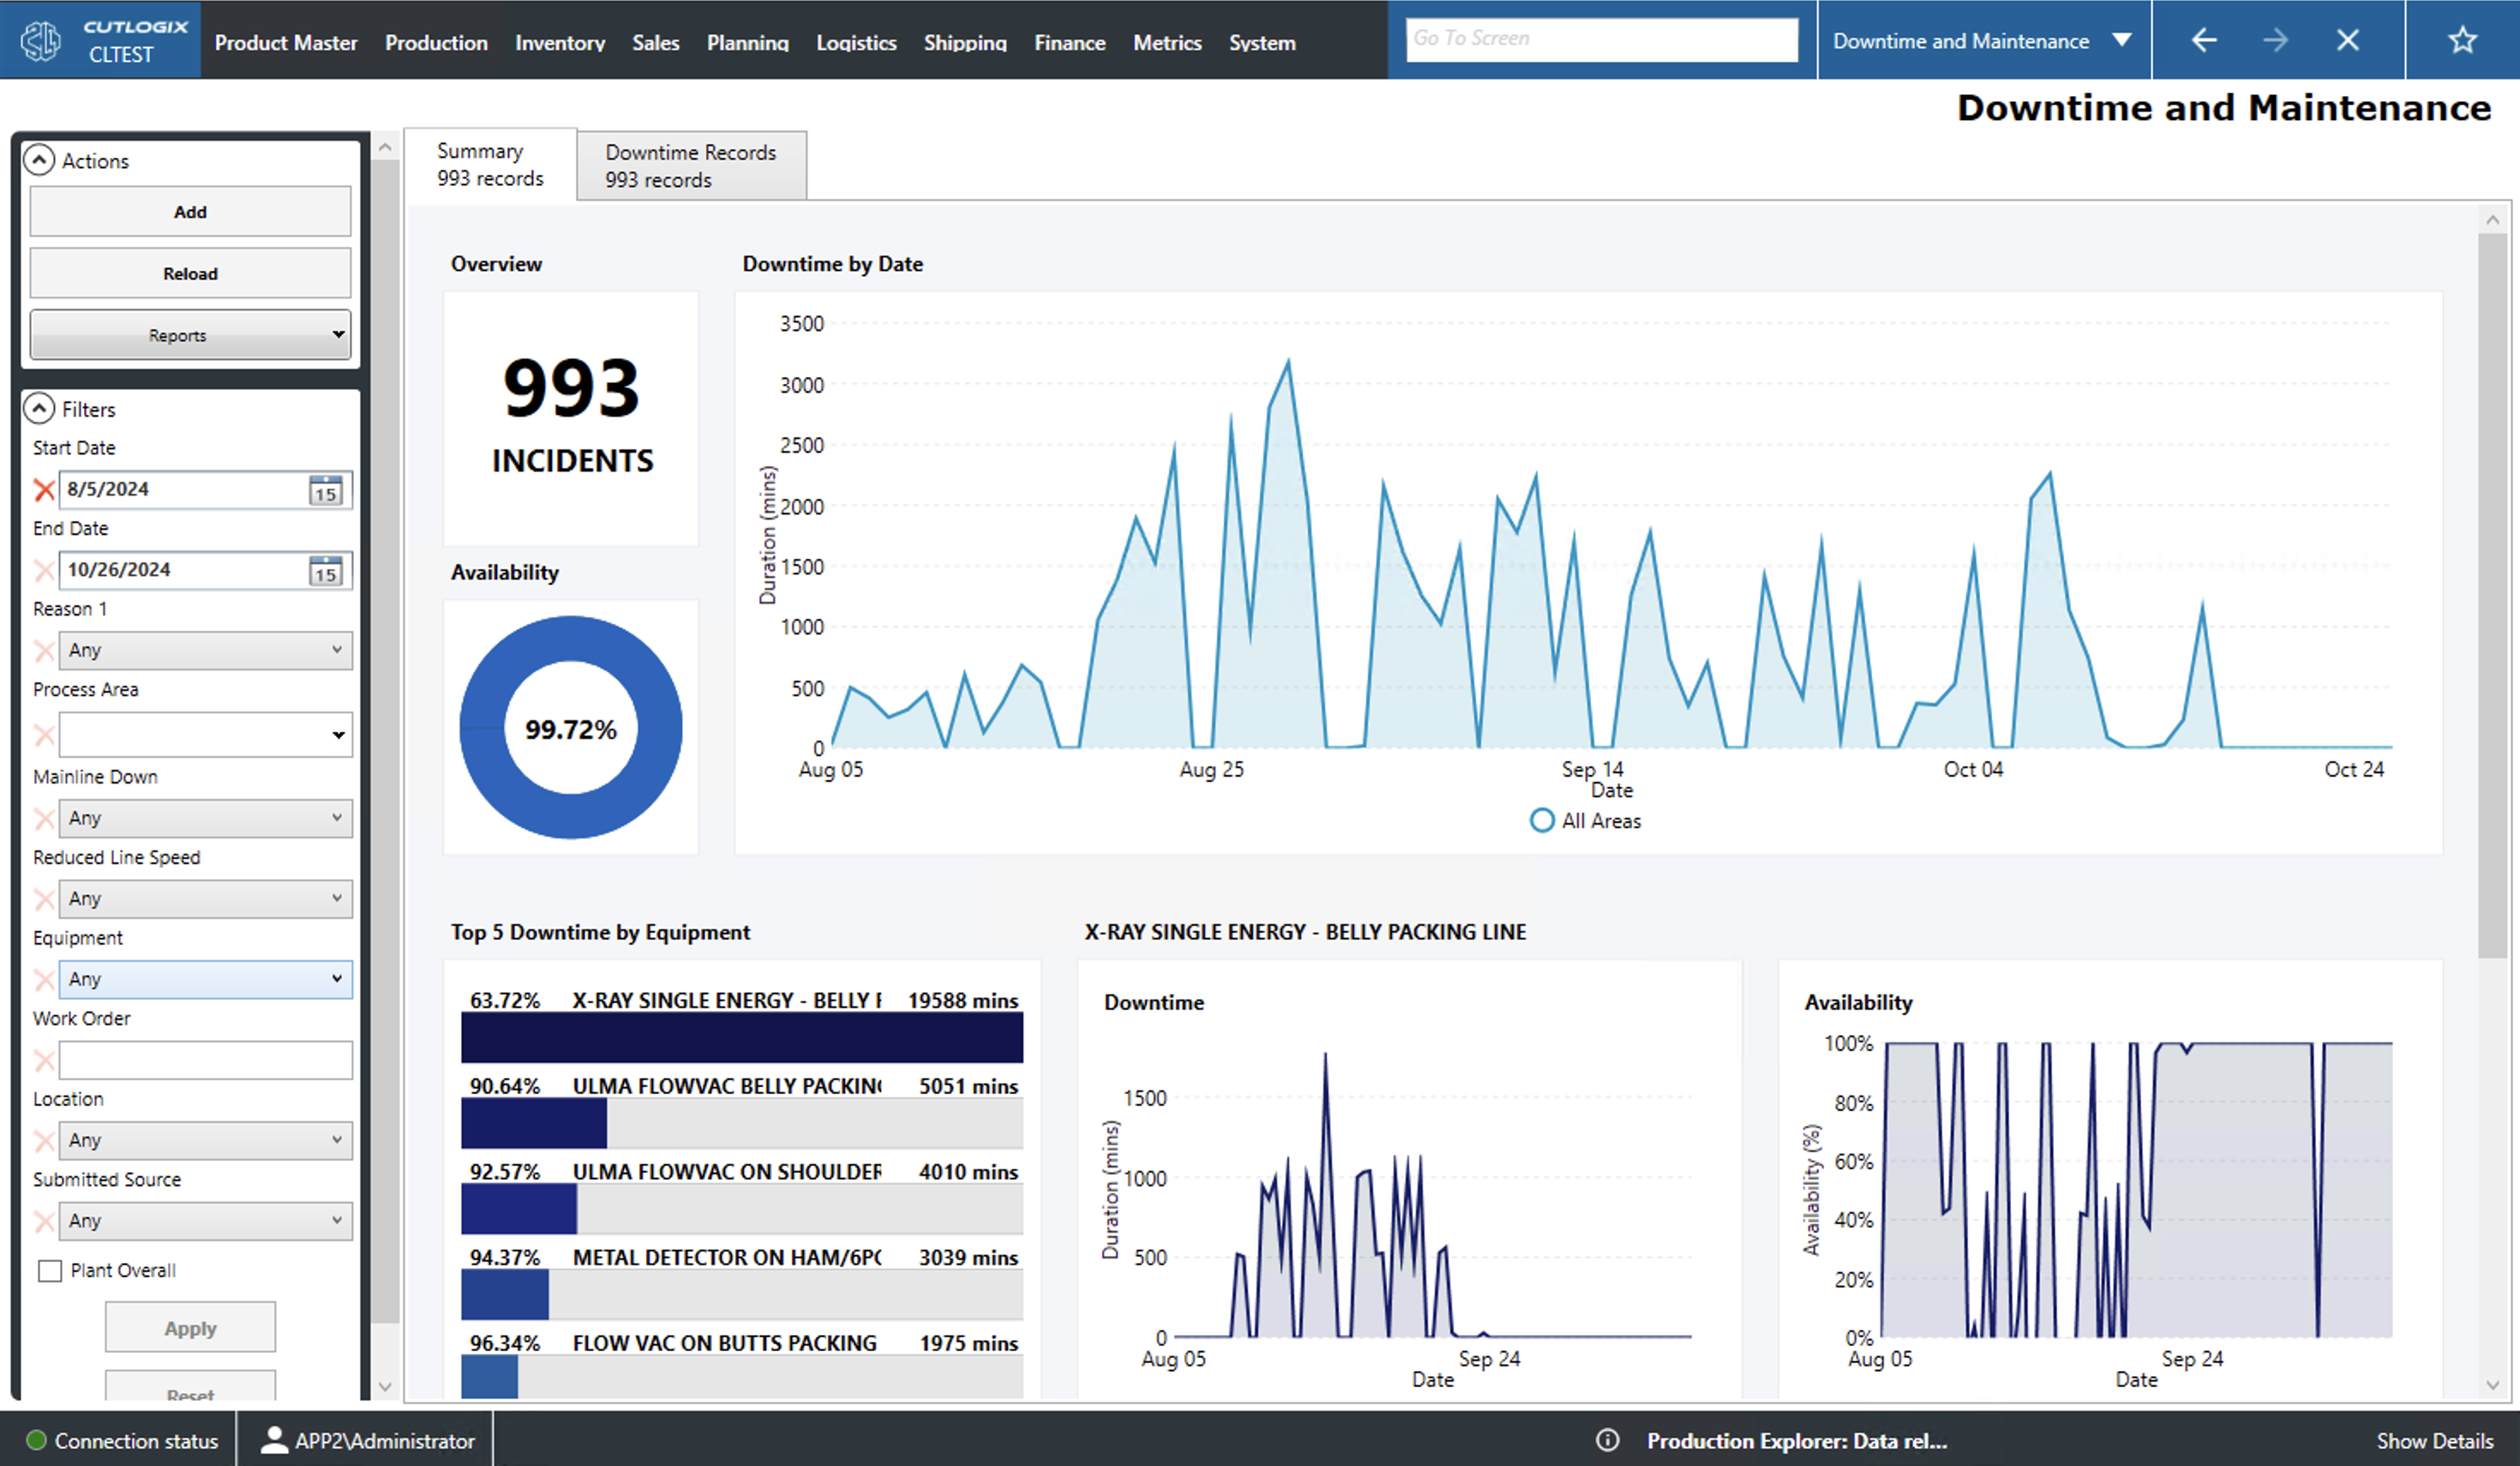
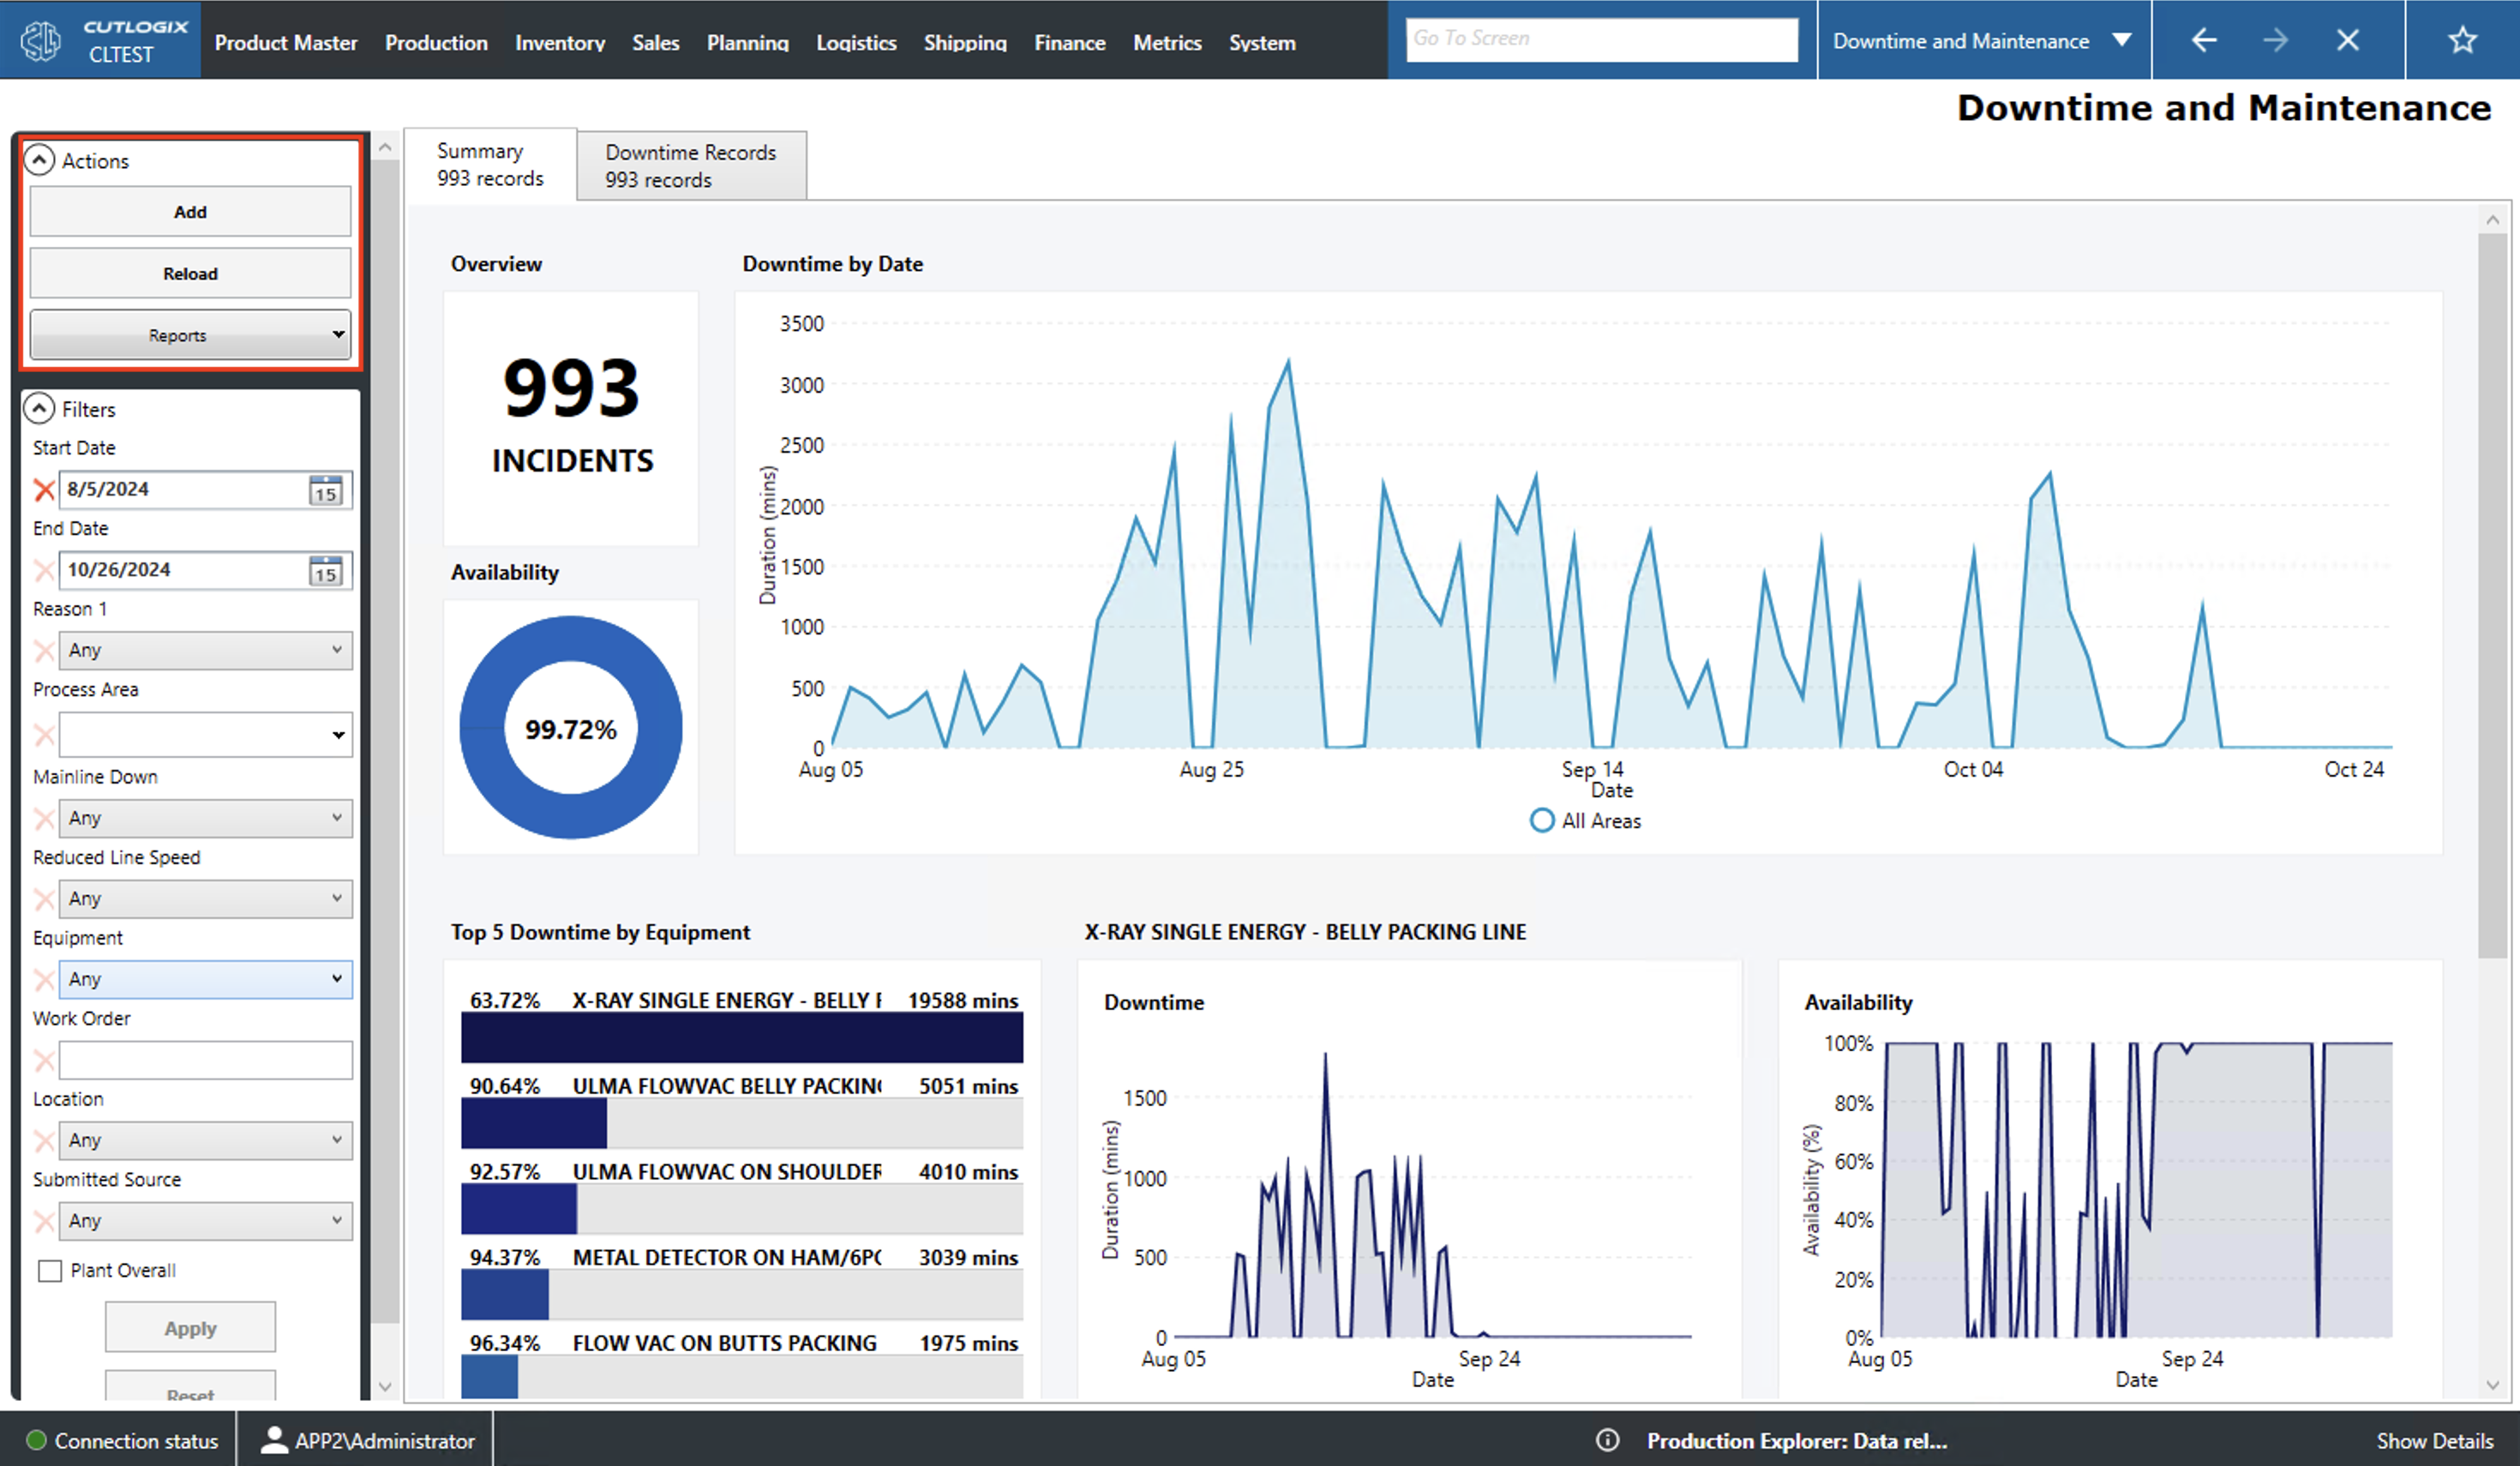
Actions
- Add: Opens a new tab from which the user can enter a new downtime record.
- Reload: This will reload the list of downtime records displaying the date information available in the database.
- View Log: View the change log for the selected downtime record. This will include what was changed, by whom and when.
- Reports: This dropdown will contain options for a number of downtime and maintenance reports. These reports are customizable upon request.
Filter
Users can use these filtering options to customize the data displayed in both the summary and downtime records tab.
- Start/End Date: Filter entries by the selected dates. Only a start date will show all entries with a production date on or after this date. Only an end date will filter to entries with a production date on or before this date. Specifying both will show all entries that fall within the range inclusive of the end points.
- Reason 1: Filters by the primary reason given for the downtime (i.e. equipment, manpower, safety, etc.).
- Process Area: Filters by the effected process area (ham line, jowl line, belly line, etc.).
- Mainline Down: Filter to records where the mainline was down.
- Reduced Line Speed: Filter to records that caused a reduced line speed.
- Equipment: Filter by the equipment that was down.
- Location: Filter by location within the plant (i.e. kill floor, cut floor, etc.).
- Submitted Source: Filter by whether the record was submitted via CutLogix or CutLogix mobile.
- Plant Overall: Filters to downtime records that had the entire plant down.